
Every wearable brand gives you a sleep score in the morning. But very few will explain how they calculated it, and every wearable calculates it differently.
When you wake up in the morning and glance at your ring or wrist and see a number like 72 or 88 or, if you had a particularly restless night, 59.
There’s always a corresponding color and message to go with it such as good, fair, needs work. It’s like a suggestion of what kind of day you’re likely to have even before you’ve had your first cup of brew.
What do these numbers mean? Here is how each company builds its score.
At a glance
- A sleep score is a proprietary metric, typically represented as a percentage or out of 100, calculated by consumer sleep tracking devices based on their estimations of one’s sleep during the night. It is not a medical metric.
- Apple is one of the few companies to publish their weights: 50% duration, 30% bedtime, and 20% interruptions. Other devices, including Oura, Fitbit, Garmin, Whoop, and Samsung, publish the factors that go into their calculation, though not the relative weightings.
- Wearables in general are really good at detecting the difference between sleep and wake but they cannot do the reverse very well. This asymmetry makes sense: sleep is a well-defined state that occurs in defined cycles, while wake is a much broader umbrella that encompasses a variety of activities.
- The underlying sleep detection algorithms in consumer devices have been benchmarked against laboratory-level sleep studies but the composite score produced by these devices has not undergone a similar scrutiny.
What does a Sleep Score really mean?
A sleep score is a summary of estimates. A device determines how long you slept, how broken your sleep was, when you fell asleep, occasionally your heart rate and variability. An algorithm boils these estimates down to a single number.
There are two important implications of that process.
The first is that a sleep score is based on estimations rather than direct measurements. Your watch can’t read your brain waves, so it has to estimate how much and how well you slept based on physical activity, heart rate, body temperature and breathing rate.
The second implication is that because these are estimations, the algorithm used to create the score is an approximation. Someone at each company had to decide how much weight to give different factors and how to balance them against each other.
That’s why the same night can score as a 71 on one device and an 84 on another. Based on how the device was calibrated, both these scores can be normal.
How Each Brand Calculates Your Sleep Score
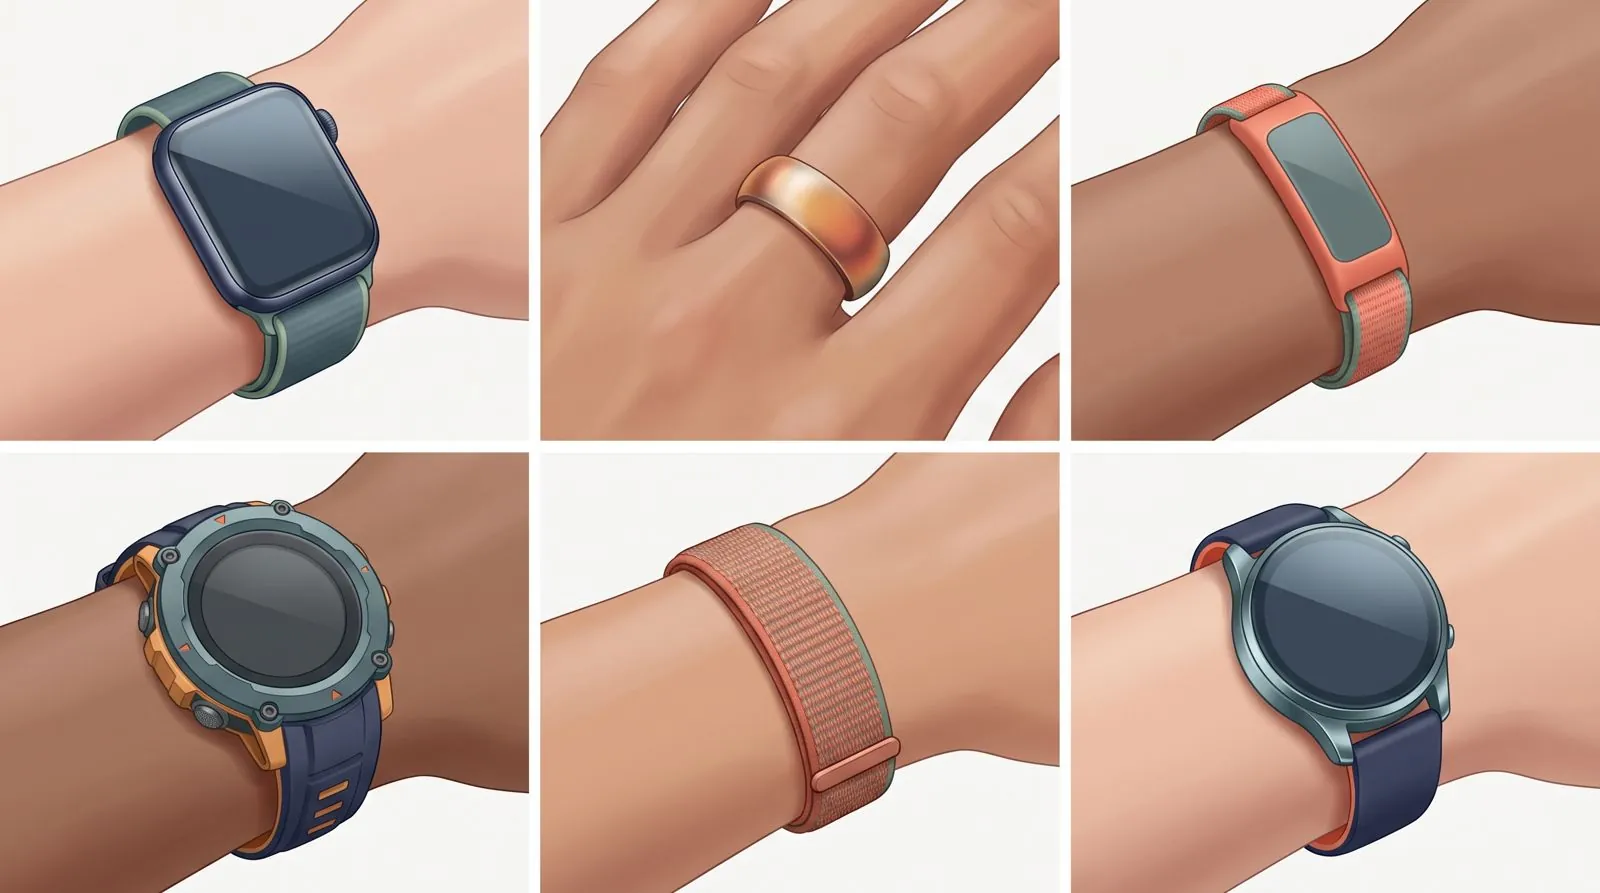
Brand | Scale | What goes into it | Publishes the weighting? | Bands |
|---|---|---|---|---|
Apple | 0-100 | Sleep duration · bedtime consistency · interruptions | Yes, 50 / 30 / 20 points | Very Low 0-40 · Low 41-60 · OK 61-80 · High 81-95 · Very High 96+ |
Oura | 0-100 | Seven contributors: total sleep, efficiency, restfulness, REM, deep sleep, latency, timing | No | Optimal 85-100 · Good 70-84 · Fair 60-69 · Pay Attention 0-59 |
Fitbit / Google | 0-100 | Six metrics: duration, time to sound sleep, sound sleep, restlessness, full awakenings, interruptions | No | Excellent 90-100 · Good 80-89 · Fair 60-79 · Poor below 60 |
Garmin | 0-100 | Heart rate, heart rate variability, respiration, movement, sleep stages, awake time, overnight stress | No | Excellent 90-100 · Good 80-89 · Fair 60-79 · Poor 0-59 |
Whoop | 0-100% (Sleep Performance score) | Four core factors: Sleep Sufficiency, Sleep Consistency, Sleep Efficiency, and Sleep Stress. | Not applicable as it is a ratio, not a composite | Optimal: 85%+ · Sufficient: 70-84% · Poor: below 70%. |
Samsung | 1-100 | How long you slept – heart rate, stages, duration | No | Excellent · Good · Fair · Needs attention, with no published cut-offs |
Apple Shows Its Arithmetic
Apple’s Sleep Score, introduced with watchOS 26, is the only one of the six that tells you the arithmetic. Duration carries 50 of the 100 points, bedtime consistency 30, and interruptions 20.
One detail stands out. Apple measures bedtime consistency against your own recent past, rather than a theoretical optimal bedtime.
That means someone who reliably goes to bed at two in the morning might score highly on consistency, while someone with an erratic but early schedule could score poorly. The score is a measure of regularity.
What the Other Five Don’t Tell You
Oura lists a total of seven contributors. Fitbit uses six metrics. Garmin lists at least seven inputs. Samsung says the score shows how long you spent sleeping.
The algorithm is the product, so companies keep it private. But it does mean that when your Oura score drops eleven points, there is no published way for you to work out which contributor caused it.
Whoop Measures Something Different
WHOOP Sleep Performance metrics measure Sleep Need, Sleep Performance (% of sleep need met), Sleep Consistency (regularity of sleep timing), and Sleep Efficiency (% of time in bed spent asleep) to assess sleep quantity, regularity, and quality.
An 85% on Whoop and an 85 on Oura are not the same statement about your night’s sleep. Whoop is saying you got most of the sleep it thinks you need, while Oura is saying your night was good in seven different ways.
Whoop reports that its members average 82%, which works out to about 43 minutes of sleep debt per night.
What does it cost to see these numbers?
One of the six brands, Whoop, requires a paid membership to see any score, and the device is supplied as part of that membership.
Oura shows its three headline daily scores, including Sleep Score, without a membership but locks the detail behind one. The other four show the sleep score with no subscription.
Brand | Subscription needed for Sleep Score? | Price if required | What it actually gates |
|---|---|---|---|
Apple | No | – | Sleep Score works on models that support watchOS 26. Included on compatible Apple Watch models running watchOS 26 or later. |
Samsung | No | – | Free in Samsung Health with a compatible Galaxy Watch or Ring. |
Fitbit / Google | No | Premium is optional: $9.99/month or $99.99/year (now called Google Health Premium) | The basic score is free. Premium adds a fuller breakdown, not the score itself. |
Garmin | No | Connect+ is optional: $6.99/month or $69.99/year | Garmin says existing features, including Sleep Score, stay free. Connect+ adds AI coaching and dashboards, not the score. |
Oura | No for the score; yes for the breakdowns | $5.99/month (first month free) | Without a membership the app shows only the three daily scores; contributor breakdowns, trends and other insights require one. |
Whoop | Yes | $199–$359/year, hardware bundled in | Whoop has no separate hardware purchase. The membership is the product; the device ships as part of it. |
Whoop’s case is that the membership lowers the entry price of the hardware itself.
(Pricing verified 14 October 2026 against each company’s own site or support pages)
What Is a Good Sleep Score?
The answer depends on the device in question. An 82 is labeled “Good” on Google Health, Oura and Garmin and “High” on Apple, but the bands under those labels start at different points: Oura’s “Good” begins at 70, the others’ at 80.
Google publishes one useful benchmark: most Fitbit users see an average sleep score between 72 and 83.
The better question is whether a score is normal for you. A score of 74 means very little on its own and quite a lot if your usual is 88.
What Is a Normal Sleep Score by Age?
As of now, there is no manufacturer that publishes a sleep-score chart by age, and you shouldn’t be misled by any site that offers one.
Sleep itself changes with age. Deep sleep declines, nights become more fragmented. Some devices, such as Fitbit, have algorithms that adjust their targets for your age and sex.
But the scores themselves are not standardized, so there is no age table that holds across brands.
Why Two Devices show different readings for the Same Night
If you wear one device on each arm and sleep, you’ll receive two different results upon waking. This is due to the fact that, each device uses its own sensors and algorithm to determine when you fell asleep, and what stage you were in.
They are weighted differently. One device may penalize a fragmented night heavily; another may care far less about total hours.
They are measured against different targets. Whoop compares your sleep with your calculated requirement. Apple compares your bedtime with your last thirteen nights.
Neither device is faulty. Their scores just cannot be compared.
How Accurate Is Any of This?
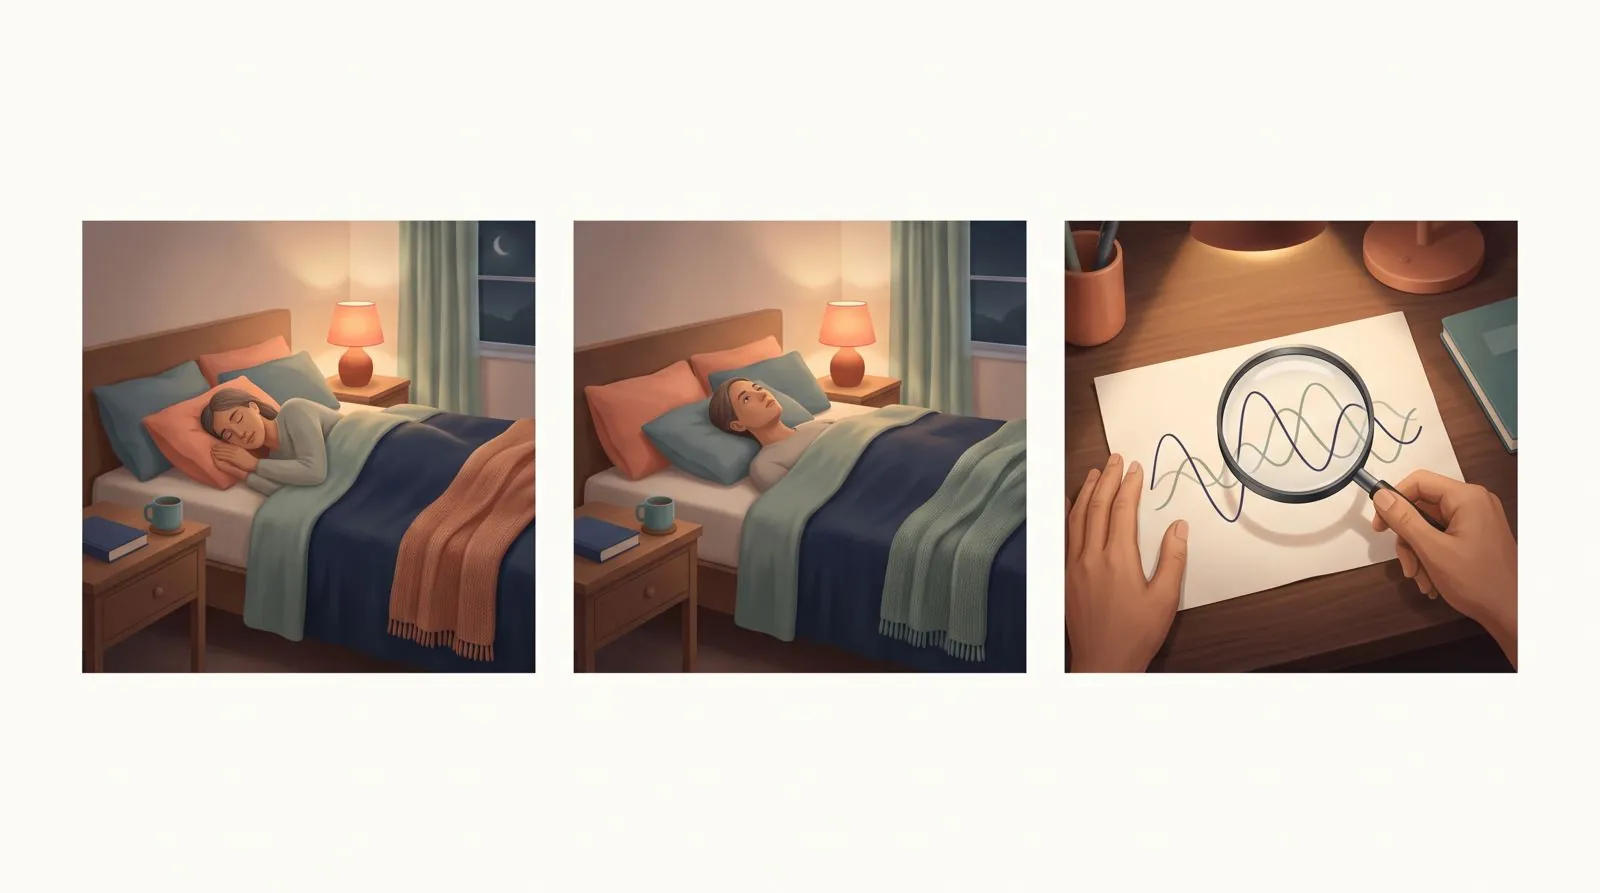
In a 2025 study in SLEEP Advances, 62 adults (52 men; mean age 46) spent one night in a sleep laboratory wearing two to four of six wrist-worn devices (Apple Watch Series 8, Fitbit Charge 5, Fitbit Sense, Garmin Vivosmart 4, Withings ScanWatch and Whoop 4.0) alongside polysomnography, the full clinical sleep study.
More than half of the participants had some degree of sleep apnea. Compared 30 seconds at a time, the devices correctly labeled 91.7-96.3% of the epochs polysomnography scored as sleep, and 29.4–52.2% of the epochs it scored as wake.
The asymmetry, in simple terms
Wearables are generally better at identifying sleep than detecting brief periods of wakefulness. As a result, lying awake quietly may sometimes be recorded as sleep.
The wearable correctly identified wakefulness in fewer than one-third of the relevant cases.
Because lying still and awake looks a great deal like sleeping, the devices tend to read quiet wakefulness as sleep. If you lay awake for an hour and your watch gave you a decent score, that is the asymmetry.
Sleep staging is difficult. A 2024 review in npj Digital Medicine covering 62 wearable setups found average accuracy of 87.2% for sleep versus wake, but only 69.7% for three-stage classification and 65.2% for four stages.
A 2025 meta-analysis in the Journal of Clinical Sleep Medicine reached the same practical conclusion: these devices tend to underestimate total sleep time and misjudge how long it took you to fall asleep, and their authors urge consumers to be aware of the limits.
The metric which hasn’t been tested
Every study above tests the detection: did the device correctly identify sleep, wake, REM?
But we don’t have studies validating the final score. There is no substantial body of peer-reviewed work showing that a sleep score of 60 predicts a worse day than a score of 85, for the same person, in any measurable way.
HRV Meaning: The Other Number on Your Screen
Most of these devices also show you heart rate variability overnight, and it is easy to misread.
HRV – Heart Rate Variability, is the small variation in the time between consecutive beats, not your heart rate. A heart beating at exactly even intervals is not a healthy heart; some variation is normal and expected.
HRV differs from person to person and can change with age, stress, sleep and other factors. A higher reading does not always mean better health. It is measured overnight because you are still, unfed and not talking, which makes one night roughly comparable with the next.
HRV Normal Range and Average HRV by Age
There is no reliable normal range you can look up.
The Cleveland Clinic gives rough clinical cut-offs for a 24-hour measure of beat-to-beat variation: below 50 ms is described as unhealthy, 50-100 ms as “compromised” and above 100 ms as healthy.
It cautions that HRV falls with age and that a normal value for one person may not be normal for another. These cut-offs should not be applied to the overnight figure a watch or ring reports, which is calculated differently.
The peer-reviewed reference work says the same thing more emphatically. A 2010 systematic review in Pacing and Clinical Electrophysiology pooled 44 studies and 21,438 healthy adults, and its main finding was how enormous the variation between individuals is.
The classic age study, published in the Journal of the American College of Cardiology in 1998, found that HRV declines steadily with age across every measure, and that women’s HRV is lower than men’s before 30 but not after 50.
So an “average HRV by age” table is at best a rough orientation. Your own trend over weeks is worth far more than your position on anyone’s chart.
That is how HRV tracking works on the devices themselves: Garmin’s HRV Status compares your 7-day average with your own three-week baseline (Balanced, Unbalanced or Low), and Whoop HRV, taken during sleep, feeds a Recovery score judged against your own trend.
What Low HRV Does and Doesn’t Mean
A low HRV is associated with several things such as cardiovascular problems, anxiety and depression, and with ordinary, temporary states such as illness, alcohol, poor sleep and hard training.
There is no proven evidence that deliberately pushing your HRV number up produces any health benefit.
How Watches and Rings Measure HRV
There is also a problem with how it is measured. Clinical HRV research is built on ECG. Your watch and your ring use an optical sensor at the skin, which measures pulse rate variability instead.
A systematic review of 43 studies published in Sensors in August 2026 concluded that optical pulse rate variability should not be regarded as universally interchangeable with ECG-derived HRV. Two brands’ HRV figures are not comparable with each other, and neither is directly comparable with the research literature.
So a wrist or finger HRV monitor is best used to follow your own trend, not to compare against a chart.
Readiness Scores and the September 2026 Pushback
Several brands now combine sleep with other signals into a daily readiness or recovery score. Apple introduced Readiness with the 2026 watches, producing a 0-10 score and one of four recommendations.
On 19 September 2026, Eric Topol, published a critique of these scores, titled The Big Holes in Wearable Heart Rate Variability And Readiness Scores.
His argument has two parts. The measurement underneath the scores is not interchangeable with the clinical research base. And even where HRV is measured well, it appears to reflect your physiological state. It does not show the cause of anything.
He notes that Apple’s Readiness score arrived with no published validation data, and that HRV feeds into 12 of the fourteen composite scores he reviewed.
He sums it up: “We’re not ready for readiness scores.”
Apnea–Hypopnea Index Score: Where the Numbers Do Get Clinical
One number here is different. The apnea–hypopnea index counts how many times an hour your breathing stops or becomes shallow, and it is a real clinical measure used to grade sleep apnea.
Several devices, including the 2026 Apple Watch, now offer sleep apnea notifications. These look for signs associated with moderate to severe sleep apnea.
This is the one place where a wearable may point you at something that needs a doctor. A diagnosis itself is made with a proper sleep study.
When does using a wearable device start causing harm
In 2017, a team led by Kelly Baron described a pattern they saw in their sleep clinic and gave it a name: orthosomnia. Patients were arriving anxious about their tracker data. Paradoxically, this anxiety was making their sleep worse.
The idea has since been taken seriously enough to be measured. A questionnaire, the Bergen Orthosomnia Scale, was published in Frontiers in Sleep in 2025.
A national survey of 1,280 US adults presented in 2026 found that about a third of people who use a sleep tracker screened positive for orthosomnia risk, roughly twice earlier estimates. That study was funded by a sleep-tracker company.
The readers saying this out loud are easy to find. One post reads simply: “My Garmin gave me a sleep score of 84 the night I went to bed with a full stomach, a beer, a glass of wine and dessert. The score said Good. My body said otherwise.”
How to Use a Sleep Score Well
The score is still useful as a rough guide.
Look at trends, not numbers.
Look at your own trend. Cross brand comparisons and internet-wide rankings will get you nowhere.
Listen to your body over the number. If you feel well-rested and the number says 62, you slept well.
Use the subcomponents. Time spent asleep and sleep consistency are actionable metrics
Take the breathing alerts seriously. Sleep apnea notifications are the one output that may need a doctor.
If the number is negatively affecting your mindset, turn it off. Nothing is being gained by having it on. There is no evidence that mere observation of sleep quality has any beneficial effect on said sleep quality.
Related reading: Wearable health tech for seniors: hype vs reality · How wearables help track the effects of GLP-1 drugs
Key takeaways
- A sleep score is one company’s opinion about your night, expressed as a number.
- Apple publishes its weighting, 50 points duration, 30 consistency, 20 interruptions. The other major brands do not.
- Most Fitbit users average between 72 and 83, which is the only broad benchmark any manufacturer publishes.
- Scores from different brands are not comparable, because the inputs, the weights and the targets all differ.
- Wearables identify sleep well and wake poorly, which is why a bad night can still score well.
- Although sleep scores can help track patterns over time, there is still limited evidence that these scores can reliably predict specific health outcomes.
- HRV has no usable universal normal range, and optical HRV is not interchangeable with clinical ECG measurement.
- Roughly a third of sleep-tracker users show signs of anxiety about their own data.
Frequently asked questions
1. What is a good sleep score?
It depends on the brand. Above 85 is Optimal on Oura, above 90 is Excellent on Fitbit, and 81-95 is High on Apple. Your own baseline is a better guide than any of these.
2. What is a normal sleep score by age?
No manufacturer publishes one. Sleep changes with age, and some algorithms adjust their targets for your age, but the scores are not standardized, so no cross-brand age chart is meaningful.
3. How do I calculate my sleep score?
You cannot, except approximately on Apple, which publishes its 50/30/20 weighting. Every other major brand lists the inputs but keeps the formula private.
4. What does a sleep score of 59 mean?
On Oura it falls in Pay Attention, on Fitbit it is Poor, and on Apple it is Low. In practice it usually means short sleep, a broken night, or an unusually irregular bedtime — and on its own, a single 59 means very little.
5. Is there a sleep score app that works without a wearable?
Some phone apps estimate sleep from microphone and movement data. They are working from less information than a wrist or finger sensor, so treat their scores as rougher still.
6. Which device is the most accurate?
For distinguishing sleep from wake, the recent comparisons put the Apple Watch at the better end of the wrist-worn group. For sleep stages, every consumer device is well short of a clinical sleep study.
7. Can my watch diagnose sleep apnea?
No. It can raise a notification suggesting signs consistent with moderate to severe sleep apnea, which is a reason to see a doctor, not a diagnosis.
8. Should I stop using my tracker?
Only if it is making you anxious. As a trend over weeks it can help; one night’s score means little.
Glossary
- Sleep score: an aggregate metric generated by the device based on its estimations of your night’s sleep.
- Sleep efficiency: a percentage representing the ratio of time actually spent sleeping to the total time spent in bed.
- Sleep latency: the duration it took you to fall asleep.
- HRV (heart rate variability): the difference in time between successive heartbeats.
- PRV (pulse rate variability): the same metric as HRV, but measured optically on the skin, which is what most wearables do.
- Polysomnography: the full clinical sleep study, to which all other metrics are compared.
- Apnea–hypopnea index: the number of apnea (temporary cessation of breathing) or hypopnea (shallow breathing lasting for at least 10 seconds) episodes experienced per hour of sleep.
- Orthosomnia: a state of anxiety induced by the obsessive pursuit of an ideal sleep-tracking score.
References
All reference links checked on 23 October 2026.
- Apple. View your sleep score on Apple Watch. Apple Support (watchOS 26 guide). Accessed 23 October 2026. https://support.apple.com/en-us/guide/watch/apded441a669/watchos
- Apple. About watchOS 26 Updates. Apple Support; 27 July 2026. https://support.apple.com/en-us/123002
- Oura. Sleep Score. Oura Member Care support article. Accessed 23 October 2026. https://support.ouraring.com/hc/en-us/articles/360025445574-Sleep-Score
- Google. What’s the Sleep Score in the Google Health app. Google Health Help Center. Accessed 23 October 2026. https://support.google.com/googlehealth/answer/14236513?hl=en
- Garmin. How Garmin watches track your sleep, calculate sleep score. Garmin Blog. Accessed 23 October 2026. https://www.garmin.com/en-US/blog/fitness/how-garmin-watches-track-your-sleep-calculate-sleep-score/
- Whoop. WHOOP Member Averages: HRV, Sleep, Recovery, and Strain. The Locker. Accessed 23 October 2026. https://www.whoop.com/us/en/thelocker/member-averages-recovery-strain-sleep-hrv/
- Samsung. Use Samsung Health sleep monitoring on your Galaxy Watch. Samsung Support. Accessed 23 October 2026. https://www.samsung.com/us/support/answer/ANS10003657/
- Schyvens A-M, Peters B, Van Oost NC, et al. A performance validation of six commercial wrist-worn wearable sleep-tracking devices for sleep stage scoring compared to polysomnography. SLEEP Advances. 2025;6(2):zpaf021. doi:10.1093/sleepadvances/zpaf021. https://academic.oup.com/sleepadvances/article/6/2/zpaf021/8090472
- Birrer V, Elgendi M, Lambercy O, Menon C. Evaluating reliability in wearable devices for sleep staging. npj Digital Medicine. 2024;7:74. doi:10.1038/s41746-024-01016-9 https://www.nature.com/articles/s41746-024-01016-9
- Lee YJ, Lee JY, Cho JH, Kang YJ, Choi JH. Performance of consumer wrist-worn sleep tracking devices compared to polysomnography: a meta-analysis. Journal of Clinical Sleep Medicine. 2025;21(3):573–582. doi:10.5664/jcsm.11460 https://link.springer.com/article/10.5664/jcsm.11460
- Xu S, Liu H, Liu Z, Su P, Gu Z. Accuracy of photoplethysmography-derived pulse rate variability compared with electrocardiography-derived heart rate variability: a systematic review and meta-analysis. Sensors. 2026;26(16):5192. doi:10.3390/s26165192 https://www.mdpi.com/1424-8220/26/16/5192
- Nunan D, Sandercock GR, Brodie DA. A quantitative systematic review of normal values for short-term heart rate variability in healthy adults. Pacing and Clinical Electrophysiology. 2010;33(11):1407–1417. doi:10.1111/j.1540-8159.2010.02841.x https://onlinelibrary.wiley.com/doi/10.1111/j.1540-8159.2010.02841.x
- Umetani K, Singer DH, McCraty R, Atkinson M. Twenty-four hour time domain heart rate variability and heart rate: relations to age and gender over nine decades. Journal of the American College of Cardiology. 1998;31(3):593–601. doi:10.1016/S0735-1097(97)00554-8 https://www.jacc.org/doi/10.1016/S0735-1097(97)00554-8
- Cleveland Clinic. Heart Rate Variability (HRV). Last reviewed 2 September 2026. https://my.clevelandclinic.org/health/symptoms/21773-heart-rate-variability-hrv
- Topol E. The Big Holes in Wearable Heart Rate Variability And Readiness Scores. Ground Truths; 19 September 2026. https://erictopol.substack.com/p/the-big-holes-in-wearable-heart-rate
- Baron KG, Abbott S, Jao N, Manalo N, Mullen R. Orthosomnia: are some patients taking the quantified self too far? Journal of Clinical Sleep Medicine. 2017;13(2):351–354. doi:10.5664/jcsm.6472 https://link.springer.com/article/10.5664/jcsm.6472
- Guldbrandsen BV, Baron K, Vedaa Ø, Bjorvatn B, Pallesen S. Development of a scale for measuring orthosomnia: the Bergen Orthosomnia Scale. Frontiers in Sleep. 2025;4:1640355. doi:10.3389/frsle.2025.1640355 https://www.frontiersin.org/journals/sleep/articles/10.3389/frsle.2025.1640355/full
- Goel R, Quan S, Ejikeme C, et al. Exploring the prevalence of sleep tracking and orthosomnia in a national survey of adults in the US. Sleep. 2026;49(Suppl 1):A246. Funded by Oura Ring Ltd. https://academic.oup.com/sleep/article/49/Supplement_1/A246/8674102
- Oura. Oura Membership. ouraring.com/membership; https://ouraring.com/membership accessed 23 September 2026.
- WHOOP. WHOOP Membership Options. whoop.com/us/en/membership; accessed 23 September 2026. https://www.whoop.com/us/en/membership/
- Garmin. Elevate your health and fitness goals with Garmin Connect+. Garmin Newsroom; 27 March 2025. https://www.garmin.com/en-US/newsroom/press-release/wearables-health/elevate-your-health-and-fitness-goals-with-garmin-connect/
- Droid Life. Google Health Premium vs Basic: features and price. 15 May 2026; accessed 14 October 2026. https://www.droid-life.com/2026/05/15/google-health-premium-vs-basic-features-price/
- Samsung. Use Samsung Health sleep monitoring on your Galaxy Watch. Samsung Support; https://www.samsung.com/us/support/answer/ANS10003657/ accessed 23 September 2026.
- WHOOP. WHOOP Sleep. WHOOP Support. Accessed 23 October 2026. https://support.whoop.com/s/article/WHOOP-Sleep?language=en_US
- Garmin. New Data Examines Quality of Garmin Users’ Sleep. Garmin Blog; 16 March 2023. https://www.garmin.com/en-US/blog/health/new-data-examines-quality-of-garmin-users-sleep/
Disclaimer
This article is for general information and is not medical advice. Decisions about your sleep or your health should be taken with a qualified doctor who knows your circumstances.
